New USDA Planting maps, the guide gardeners rely on to figure out which plants grow and thrive best in a particular location
Posted on January 25th, 2012 by Andy
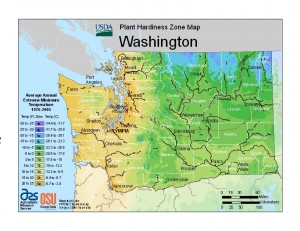
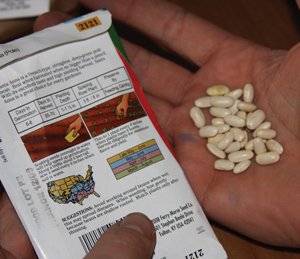
 The USDA recently unveiled new plant hardiness zone maps, the guide many gardeners rely on to figure out which plants grow and thrive best in a particular location. The maps give you the historic average annual coldest temperatures for a particular area; nurseries and seed producers often include these zones on plant tags and seed packets to indicate how hardy a plant is. Use this handy online tool to enter your zip code and find out your new zone.
Our Ecoyards’ office in West Seattle is now in zone 8B; that means the average annual coldest temperature for a past 30-year period were between 15 and 20 degrees F. According to the old hardiness maps, our office was located in zone 7B, where the average coldest temperatures were between 5 and 10 degrees. Gardeners will likely be able to plant a few more things that they previously weren’t able to, or at least push their luck a bit more. But by and large, the changes aren’t likely to be too drastic. There are a lot of plants such as aster, green beans, asparagus and peonies grow great in both zones 7 and 8, so we won’t be pulling out plants or rearranging the planting lineup too much. As gardeners in the Northwest know, each garden and landscape can have its own micro-climate based on the amount of sunlight it gets, whether it’s sheltered or exposed, is south-facing and so on. The hardiness maps are just a good “rule of thumb” guide.
 The most interesting aspect of the new maps may be that they indicate that temperatures are warming across the U.S. As The Associated Press points out in this article:
The government’s colorful map of planting zones is being updated for a warmer 21st century. The official guide for 80 million gardeners and a staple on seed packets reflects a new reality: The coldest day of the year isn’t as cold as it used to be. So some plants that once seemed too vulnerable to cold can now survive farther north. It’s the first time since 1990 that the U.S. Department of Agriculture has updated the map and much has changed. Nearly entire states, such as Ohio, Nebraska and Texas, are in warmer zones.
The new map relies on weather station data from 1976 to 2005, compared to the 1990 map that used statistics from 1974 to 1986. Experts say that increased accuracy in weather data will be really useful for gardeners and others.
Filed under:Seattle Landscape Design, Seattle Landscape Maintenance | Permalink |


